August 6, 2026
Does the AI Rally Have Legs?
Four of five gauges say yes. One says be careful what you pay.
First a note from InvestorPlace Media
Editor’s Note: Elon’s next launch will be bigger than SpaceX, Tesla and xAI combined, says the man voted America’s #1 stock picker in 2020. Get the full story from my colleague while there’s still time.
Dear Reader,
The U.S. Treasury is preparing to make a major change to how you access Social Security.
The IRS are involved, too.
As is Elon Musk.
And President Trump.
In fact, the White House has already passed TWO Executive Orders paving the way for a radical change to how millions of Americans spend, save and access government benefits.
It could be the biggest shift to our money system in decades and change the way you receive your social security check.
One Wall Street insider says banks should be ‘scared s**tless’.
And Elon Musk says it could be the end of traditional banking as we know it.
It all comes down to a $480 trillion reset that could change your life in several very strange ways.
It’s been approved in 50 states already.
And the technology involved is being rolled out all over our country.
Get the full story today, before it’s too late.
Best,
Luke Lango
Senior Investment Analyst, InvestorPlace
P.S. The last time I saw a change like this coming you could have made as much as 31,000% over the course of a decade. This time, the gains could be even bigger.
Hey there, bargain hunter. Everyone has an opinion on whether the AI rally is real. Bulls point to NVIDIA’s $81.6 billion quarter. Bears point to a revenue gap that Sequoia now sizes at roughly $600 billion annually. Both sides are right about their chosen data point. Neither side is giving you a framework you can actually use.
So here is one.
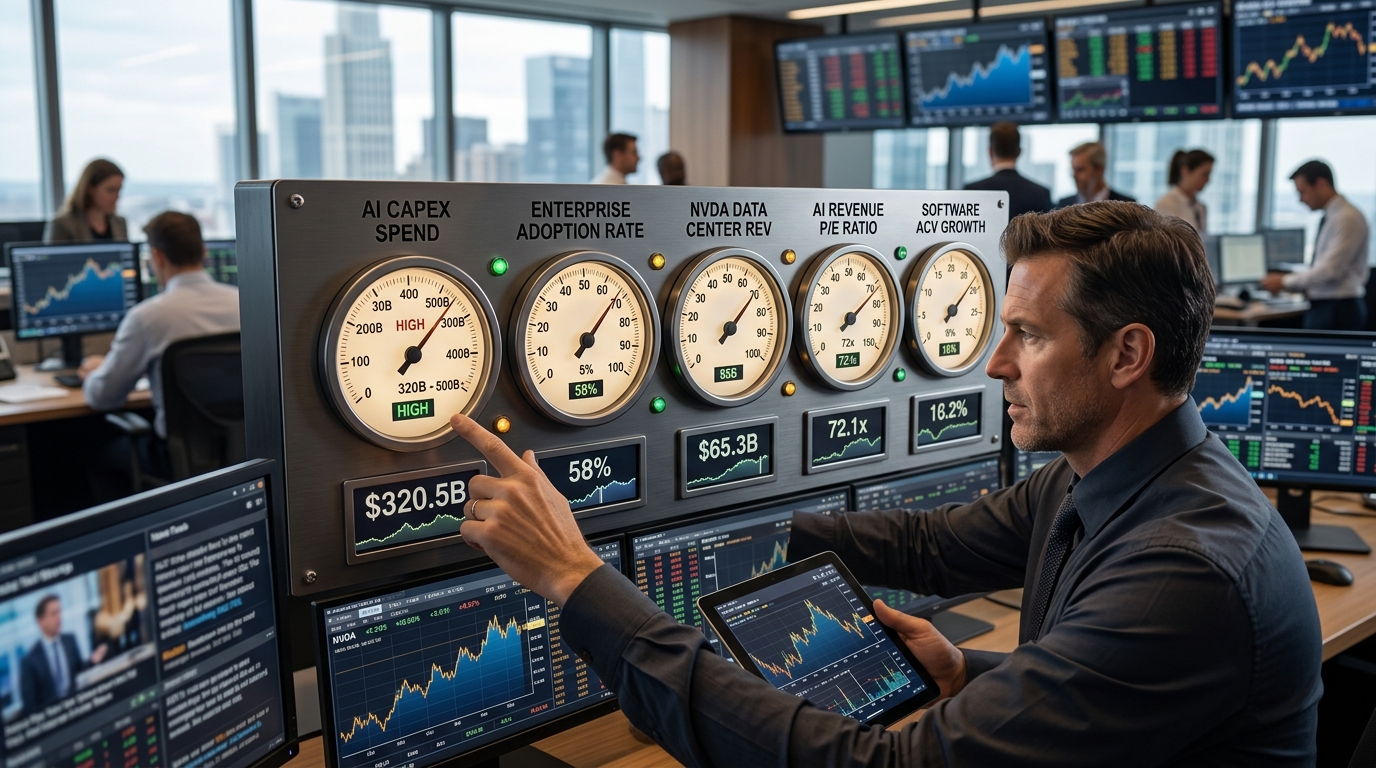
The AI rally is not a single trade. It is five separate bets layered on top of each other, each with its own leading indicator. If you know which gauge to watch for each layer, you stop guessing and start tracking. That is what this piece is about.
Where the Rally Stands Right Now
The Bloomberg AI Index has gained 26% in 2026, outperforming the Nasdaq-100 and the broader World Tech Index. That sounds euphoric until you check the valuation math: EV-to-sales multiples are still sitting roughly 21% below the December 2024 peak, according to Bloomberg Intelligence analysis. The bubble chatter arrived before the valuations that would justify it.
Underneath that headline, the composition of the rally has already shifted once. The first half of 2026 was dominated almost entirely by semiconductor and AI hardware names. Then in early July, the PHLX Semiconductor Index dropped roughly 12% over two sessions as positioning in the complex unwound hard. The Nasdaq Composite was down 4.1% in the month through July 17 alone.
Since early August, the picture has changed again. In late July, technology earnings lifted growth stocks broadly, small caps joined the advance, and the market saw a session with unusually strong breadth. Breadth that wide is not a frothy top signal. It is the opposite.
So the rally is alive. But whether it extends or exhausts depends on five specific readings. Here they are.
The Real Reason This Is Hard to Read
The central tension in the AI trade is not valuation. It is timing. Capital is moving at infrastructure speed. Revenue is moving at enterprise adoption speed. Those two clocks do not tick at the same rate.
On the capital side: the five largest hyperscalers are on pace to spend somewhere between $700 billion and $900 billion on capex in 2026, about a 36% increase over 2025 according to CreditSights estimates. Amazon alone has pointed to roughly $200 billion. Meta lifted its 2026 capex outlook to $130 billion to $145 billion, citing higher component costs. Microsoft is tracking above $120 billion for its fiscal year. Alphabet originally guided $175 billion to $185 billion, and has since raised its fiscal 2026 capex outlook.
On the revenue side: Sequoia partner David Cahn calculates that there is roughly a $600 billion annual revenue gap between what the ecosystem is spending on AI infrastructure and what it is generating in AI application revenue needed to justify that spend. OpenAI and Anthropic combined were generating tens of billions of dollars in annualized revenue as of 2026, which is meaningful but still small relative to that gap.
Allianz Research puts the divergence between AI capital expenditure growth and AI revenue growth at approximately 46%. The telecom overbuild of 2001, which preceded a brutal multi-year correction, showed a divergence of 32%. The current gap is already wider.
That is the bear case in two sentences. It is a serious one. But it is not the complete picture, and it is not yet a verdict. Here is why.
The Five Gauges
Gauge 1: Backlog Conversion Velocity
The hyperscalers are not spending into a vacuum. Microsoft reported commercial remaining performance obligations of $627 billion, up roughly 110% year-over-year. Google Cloud’s backlog surpassed $460 billion in Q1 2026. These are signed contracts, not press releases. The question is not whether the demand exists. It is how fast committed future revenue converts into recognized revenue.
Watch the ratio of RPO growth to revenue growth each quarter. If RPO keeps ballooning while revenue growth stays flat, the runway is extending but the engine has not fired. If revenue growth starts closing the gap to RPO growth, the conversion is working. Microsoft’s AI revenue surpassed a $37 billion annual run rate in fiscal Q3 2026, up 123% year-over-year. That is conversion happening in real time. The gauge is flashing green there, amber everywhere else.
Building Momentum. Breaking Ground.
They’ve reserved the NASDAQ ticker FASF. They just broke ground on their $850M flagship coal reformation facility in West Virginia. Frontieras is hitting massive milestones in very little time. This positions the company for potential valuation impact. Final weeks to become an early-stage shareholder.
Join 12K+ people and invest in Frontieras at $9.01/share by 8/6.
Disclosure: This is a paid advertisement for Frontieras’s Regulation A offering. Please read the offering circular at invest.frontieras.com
Gauge 2: Enterprise ROI Breadth
This is the most uncomfortable number in the whole AI trade. Only 29% of enterprises see significant ROI from generative AI, according to a 2026 survey conducted by Writer. A PwC Global CEO Survey of 4,454 executives found that only 12% of CEOs reported AI delivering both revenue growth and cost reductions simultaneously. The majority, 56%, said they had not yet seen significant financial benefits from their AI investments.
The bull case does not require that number to go to 100%. It requires it to move. If the 29% ROI cohort expands to 45% by the end of 2026, the revenue gap starts closing from the demand side. If it stalls, you have a situation where hyperscalers are building capacity for enterprise customers who cannot yet monetize what they are buying. Watch enterprise AI software revenues, Palantir’s U.S. commercial growth rate, and Microsoft Copilot seat additions as proxies.
Palantir just gave you a data point worth taking seriously. The company has not reported Q2 2026 results as of August 6, 2026. Until it does, treat any specific Q2 2026 revenue, profit, and guidance figures as unconfirmed.
Gauge 3: Market Breadth Beyond the Semiconductor Core
The AI rally started as a picks-and-shovels trade: NVIDIA, memory, networking, power. It is healthiest when it broadens beyond that core into the companies that consume AI output and convert it into cash flows that are not contingent on building more infrastructure.
The first-half 2026 data is encouraging. The Russell 2000 surged nearly 22% in the first half of 2026, its best H1 performance since 1991. Chip-related companies account for a meaningful share of the Russell 2000’s top performers this year. Small and mid-cap equities have now outperformed large caps for four consecutive quarters, including Q1 2026, when the S&P 500 fell 4.3% and the Russell 2000 posted a gain.
That breadth is a structural positive. But it has a caveat. As Morningstar analysts have noted, valuations in the formerly cheap corners of the market have stretched too, meaning the broadening has partly converted into a valuation problem of its own. The gauge is green on breadth, amber on the price paid to get that breadth.
Gauge 4: Free Cash Flow at the Hyperscaler Layer
This is the number that separates a productive buildout from a debt-financed infrastructure overbuild. Hyperscalers now spend 45% to 57% of revenue on capex, ratios previously seen only in industrial utilities and telcos. Capital intensity at that level means internal cash generation is under pressure to keep up with the buildout. Morgan Stanley has described a roughly $1.5 trillion financing gap across AI and data center buildout over the next several years, with credit markets potentially bridging part of it.
The five largest hyperscalers are unlikely to generate meaningful aggregate free cash flow in 2026. If analysts are right, FCF returns to 2025 levels by 2029. That is a three-year window where the equity market is essentially pricing in a leap of faith. Moody’s warned in its 2026 AI outlook that capex is outpacing the revenue being generated by AI applications and that bubble concerns are rising. That sentence came from a ratings agency, not a short seller.
The gauge to watch is simple: quarter-over-quarter change in operating cash flow at Amazon, Microsoft, Alphabet, and Meta. Operating cash flow must grow to sustain capex growth without indefinite debt issuance. Microsoft generated $50.3 billion in cash flow from operating activities in Q1 FY27, up from $27.4 billion a year earlier. That is a real number. The rest of the cohort needs to show the same trajectory.
Gauge 5: Data Center Utilization
Sequoia Capital has identified 2026 as a “moment of truth” for the AI infrastructure cycle. The firm’s framework is blunt: if hyperscaler data centers show utilization rates climbing above 70%, the buildout was prescient and infrastructure investment will compound returns for a decade. Below 50%, the telecom replay scenario gains credibility, with potential writedowns beginning in earnest by late 2026.
Current public disclosure on utilization is thin. The hyperscalers do not report a clean utilization number. But the proxies are inference revenue growth, GPU-as-a-service pricing trends, and whether supply or demand is the stated constraint. Through Q1 2026, the major hyperscalers have often characterized key AI inputs as supply-constrained rather than demand-constrained. That is a utilization signal. It does not prove 70%, but it argues against 50%.
NVIDIA’s Q1 FY2027 data center revenue of $75.2 billion, up 92% year-over-year, and the company’s updated reporting that separates hyperscale from its newer ACIE enterprise customer category, suggest demand is broadening beyond the biggest cloud buyers. That is exactly what a healthy utilization trend looks like at the chip layer. Claims that NVIDIA captures roughly 57 cents of every dollar hyperscalers spend on AI infrastructure are not a stable, widely corroborated figure, so treat them as a model assumption, not a fact.
Key Metrics to Track
- Bloomberg AI Index YTD return: +26%, with EV/sales 21% below December 2024 peak
- NVIDIA Q1 FY2027: $81.6B revenue (+85% YoY), Q2 guidance of $91B, data center at $75.2B (+92% YoY)
- Hyperscaler combined 2026 capex: $700B to $900B, up approximately 36% year-over-year
- Microsoft RPO: $627B commercial backlog, AI revenue run rate above $37B annually (+123% YoY)
- Google Cloud backlog: $460B+
- Enterprise AI ROI: 29% of organizations report significant ROI; 12% of CEOs report both revenue gain and cost reduction (PwC 2026, 4,454 executives)
- Russell 2000 H1 2026: +22%, best H1 since 1991; small/mid-cap outperformance for four consecutive quarters
- Sequoia capex-to-revenue gap: roughly a $600B annual gap in the math between infrastructure spend and application revenue needed to justify it
- Allianz capex-revenue divergence: 46%, versus 32% during the 2001 telecom excess cycle
Is It Cheap?
The Bloomberg AI Index trades at EV-to-sales multiples that are, by the index’s own historical standards, not extreme. The peak was December 2024. The current level, 21% below that peak, represents a meaningful compression even as fundamentals improved. On a forward earnings basis, 2026 AI earnings growth is estimated at 37% year-over-year, which is the number that separates “expensive but growing” from “expensive and stalling.”
The man CNBC calls “The Prophet” says: “This is the most important retirement stock in America right now.”
A little-known company that beat Apple, Amazon, and the S&P 500 – combined.
It doesn’t drill for oil… build A.I. chips… or write code.
Yet the White House invoked emergency powers to protect what it controls – and one billionaire just put half his $9 billion fund into it.
Right now, it’s trading at a rare discount.
The valuation question inside the rally is more nuanced than the index level suggests. NVIDIA trades at a premium that reflects roughly 75% gross margins and near-monopoly infrastructure positioning. Palantir’s exact current-year growth and profitability metrics should be updated only after its Q2 2026 report is out. Those are not the same valuation bet. The concerning valuations sit in the middle of the supply chain: names priced as if every AI project succeeds, yet without NVIDIA’s margin profile or clear conversion evidence.
On the Bloomberg Intelligence forward price-to-book versus forward return-on-equity framework, Super Micro Computer and Wistron screen as among the cheapest names in the AI index. Intel and Coherent screen as among the richest relative to their fundamentals. That spread tells you where the mispricing risk is concentrated.
Bull, Base, and Bear
Bull case: Enterprise ROI breadth expands from 29% toward 45% by year-end, backlog conversion accelerates at Microsoft and Google Cloud, utilization proxies stay supply-constrained, and the Russell 2000’s AI-linked semiconductor exposure continues to broaden the rally’s earnings base. The revenue gap starts closing from both ends simultaneously. NVIDIA’s Q2 FY2027 report on August 26 delivers another guidance beat above $91 billion, and the melt-up resumes.
Base case: The rally consolidates between now and September. The August 12 CPI reading and the September Fed meeting create macro volatility. Hyperscaler cash flow stays pressured in aggregate for one or two more quarters, keeping the capex-skeptic argument alive. Revenue conversion is real but slow. The Bloomberg AI Index finishes 2026 up 20% to 30%, led by software monetization names and lagged by pure hardware exposure.
Bear case: Utilization data, however imperfectly disclosed, begins suggesting demand-constrained rather than supply-constrained conditions by Q3. Enterprise ROI surveys stay stuck below 30%. The 46% capex-revenue divergence widens further. The telecom parallel finally finds the data point it needs. The AI Index gives back 2026 gains and concentration risk amplifies the move across the Nasdaq-100.
Action Plan
The five gauges tell you what to own at each level of conviction.
High conviction, own now: Companies already demonstrating revenue conversion at scale. Azure’s sustained growth makes Microsoft the safest hyperscaler bet for investors who want infrastructure exposure without pure hardware risk.
Medium conviction, scale in on weakness: NVIDIA on any pullback driven by macro rather than fundamental deterioration. The $91 billion Q2 guidance and roughly 75% gross margins are not priced for failure. But the stock is also not cheap. A 10% to 15% drawdown tied to a macro event, not an earnings miss, is the entry point worth waiting for.
Low conviction, watch not own: Pure data center hardware plays that have not yet shown operating leverage. Until utilization rates are more transparently disclosed and enterprise ROI breadth moves above 40%, the capex-skeptic argument keeps a ceiling on the multiple you can pay for companies whose revenue is entirely contingent on build, not use.
Scale-in framework: Allocate one-third of your intended AI position now. Add one-third on NVIDIA’s August 26 earnings if guidance moves above $95 billion. Hold the final third for either a macro-driven drawdown in September or the first quarter in which enterprise AI ROI surveys show a meaningful step-up above the current 29% cohort. Do not chase breadth after the Russell 2000’s 22% H1 run. Let the earnings confirm the rotation is structural, not tactical.
Cheap Investor Checklist
- Gauge 1 – Backlog conversion: Is Microsoft’s commercial RPO growth rate being matched by Azure revenue growth acceleration? (Target: Azure sustains 40%+ through Q3)
- Gauge 2 – Enterprise ROI breadth: Does the next enterprise AI survey show the 29% ROI cohort expanding? (Watch: Palantir U.S. commercial deal value, Copilot seat count)
- Gauge 3 – Market breadth: Is the Russell 2000 still outperforming the S&P 500 on a rolling four-week basis? (Current answer: yes, four consecutive quarters of outperformance)
- Gauge 4 – Hyperscaler FCF: Is Microsoft operating cash flow growing faster than capex? ($50.3B operating cash vs. $37.5B capex in Q1 FY27 is a favorable ratio)
- Gauge 5 – Utilization proxy: Are the hyperscalers still citing supply constraints rather than demand constraints on their earnings calls? (Current: often supply-constrained)
- Valuation check: Is the Bloomberg AI Index EV/sales multiple still more than 15% below the December 2024 peak? (Current: 21% below)
- Earnings quality: Is AI earnings growth still running above 35% year-over-year in aggregate? (2026 consensus: 37%)
- Risk flag: Has any hyperscaler shifted language from supply-constrained to demand-constrained? That is the single most important sentence to look for on any earnings call.
- FCF red line: Watch for any Moody’s or S&P credit action after the 2026 warnings about capex outrunning AI application revenue. A downgrade of any hyperscaler debt on AI ROI grounds is a stop-loss trigger for hardware-heavy positions.
- Gap math: Track major AI application revenue figures quarterly. The gap Sequoia highlights only closes if application revenue growth stays steep while capex growth slows. If not, the math stays uncomfortable.
Bottom Line
The AI rally has legs. Whether those legs carry it another 20% or another 5% before the next consolidation depends on five gauges, not one headline number. Right now, four of the five are flashing green or amber. Only the enterprise ROI breadth gauge is stuck in a place that should make you cautious about paying peak multiples for pure-infrastructure exposure.
If enterprise software monetization accelerates, the enterprise monetization curve is steeper than the surveys suggest. If it does not, the aggregate ROI data wins and the capex-skeptics collect. Either way, you do not need to resolve that debate to act. You need to size your positions by gauge, not by conviction, and watch the five numbers that will tell you which scenario is unfolding before the market prices it in.
The rally is real. The gap is real. They are not mutually exclusive. That is the trade.