
The Shocking Truth about the AI Bubble
In just 48 hours, a tidal wave of bad news battered AI stocks:
- Chip giant Intel dropped 29%…
- Google had its worst day ever, losing $500 billion in value…
- And tech stocks plummeted by more than $1 trillion in one trading day…
That’s more than $153 billion vaporized each hour!
Top internet news site Drudge Report had this headline screaming at the top of the page…
“$10 trillion ‘AI Boom” starting to crack…”

So is the AI bubble finally bursting?
It sure as heck looks like it…
But here’s the shocking truth: it isn’t bursting for every stock.
On the same day Intel plunged 29%, the S&P 500 fell just 1.8%.
In other words, the stock market is splitting in two.
And the independent millionaire who recommended NVDA at $6 saw this coming.
He calls this stock market split the Great AI Shock.
On one side, the most hyped AI stocks could see a 77% meltdown…
On the other side, a little-known corner of AI that NVDA’s CEO calls a “once-in-a-generation opportunity” could produce triple digit gains over the coming months…
And the recent carnage is only the beginning – because the stock market split is just getting started…
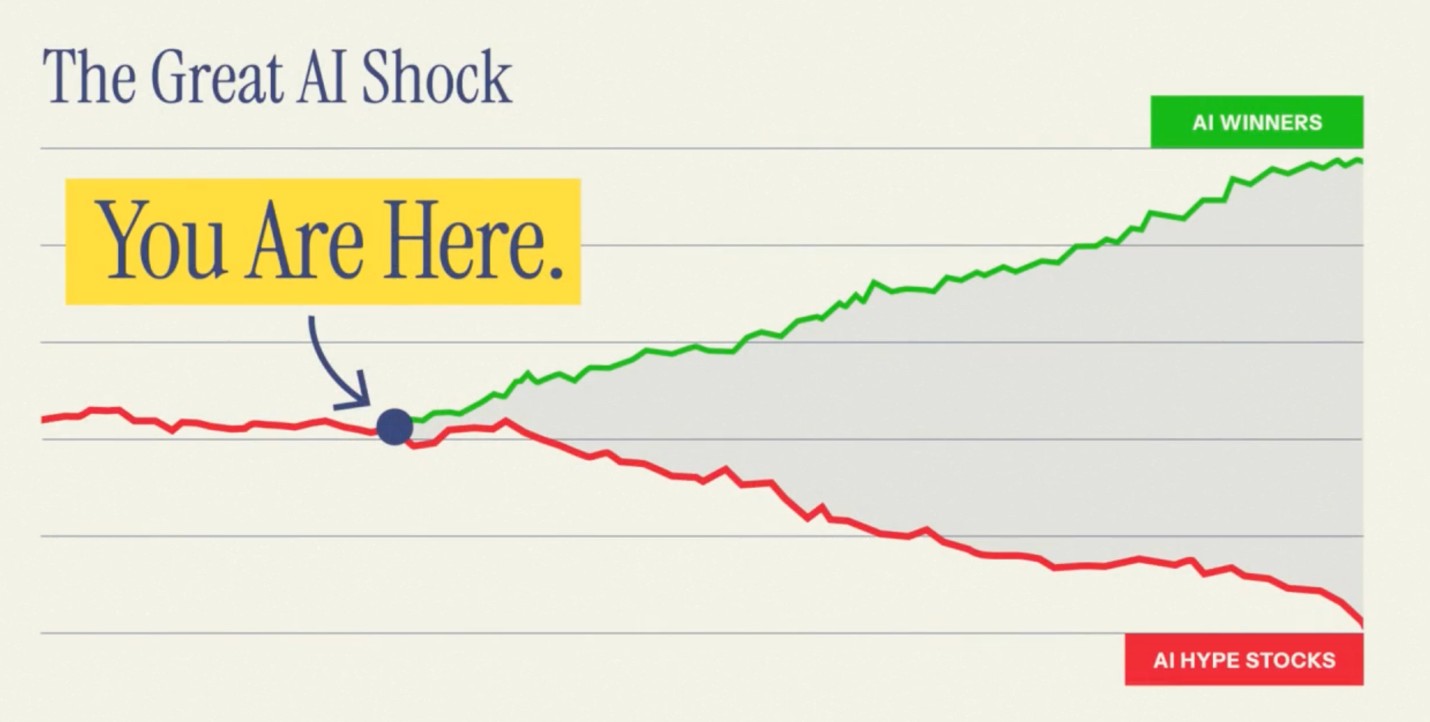
If you own any AI stocks, you need to decide which side of the split you’re on…
And you need to decide soon.
See the full story here, including details on the #1 stock on the right side of the split.
Home Sales Could Hit a 2026 Low Today. Here Is What It Means for Homebuilder Stocks.

The number drops at 10:00 a.m. Eastern today, and the housing market’s critics may be proven right. The National Association of Realtors releases its October existing-home sales count, and Wall Street’s consensus sits around the high-3.8-million range annualized. That would put sales near the current cycle low of 3.85 million, set in October 2023, and would likely mark 2026 as one of the weakest years for home sales in decades.
The case for a weak number is straightforward. September existing-home sales came in at 3.99 million, with inventory rising to 1.60 million homes. Since then, conditions have tightened further. The 30-year fixed mortgage rate moved back to around 7.3% after a hot October CPI report. That is roughly a full percentage point higher than a year ago.
The forward-looking data is unambiguous. Newly pending listings, a leading indicator for next month’s closed sales, fell 16.8% from last October, marking the biggest annual drop since August 2023 and the slowest October since 2018. Pending home sales averaged a mortgage rate of 7.33% in October, a three-year high. Those are the contracts that will show up as today’s closings. The buyer strike is not softening; it is deepening.
The Federal Reserve is not about to offer relief. Fed Governor Christopher Waller said Tuesday he would support a quarter-point rate increase at the Fed’s December meeting and said a half-point move should be considered if inflation data worsens. Traders are treating a December hike as a live possibility ahead of the December 8-9 meeting. For a housing market running on sub-7% mortgages as recently as February, this is a material shift.
What This Means for Homebuilder Shares
The existing-home market and the new-home market are connected but not identical. When resale supply tightens, buyers turn to new construction, handing builders pricing power. The reverse is also true: a resale market flooded with inventory at competitive prices squeezes the builders’ ability to hold margins. Right now, existing-home sales stayed below a 4 million pace for a second consecutive month as inventory reached its highest level since November 2019. That inventory overhang limits builders’ room to maneuver.
D.R. Horton management indicated in October that incentives are likely to remain elevated, with roughly 90% of its mortgage customers expected to utilize rate buydowns, and the company is not assuming meaningful improvement in mortgage rates in the near term. That is a margin story, not just a volume one. DHI expects first-quarter fiscal 2027 home sales gross margin of 18% to 18.5%, reflecting lower average sales prices and higher incentive costs.
PulteGroup and Lennar face the same calculus. PHM trades at roughly the low-teens multiple of earnings, which is attractive if demand stabilizes. Rising mortgage rates are pressuring homebuilder stocks in 2026, yet analysts see upside for D.R. Horton, PulteGroup and Lennar despite mixed institutional buying and rating trends. The gap between the analyst case and the rate reality is exactly the tension today’s report could resolve, one way or the other.
The margin squeeze at DHI, LEN and PHM does not exist in isolation from supply-side data. Housing starts falling to or below August’s pace removes the last argument homebuilder bulls have been leaning on across all three names.
How to Think About This in a Portfolio
Investors sitting in DHI, LEN or PHM should watch three numbers in today’s release: whether the sales pace breaks below 3.85 million and sets a new cycle low, whether months’ supply climbs above the current 4.8 months, and whether the median price holds its year-over-year gains. A pace meaningfully below recent levels combined with rising inventory would put further pressure on builder margins and likely hit the stocks.
The longer thesis for homebuilders, structural undersupply and demographics, has not changed. But the entry point matters enormously when margins are compressing and a tightening cycle has further to run. The 16.8% fall in newly pending listings is the leading indicator, and it points to November closings that will look even weaker, even if conditions have already started to ease. That is the number to hold in mind today, whatever the headline shows.
The wealth-building lesson here is durable: housing is not a monolithic market. The resale market, the new-construction market, and the homebuilder equity market each respond differently to rate cycles. Owning the distinction, and monitoring the leading indicators rather than the lagging data, is what separates an informed investment decision from a reactive one.