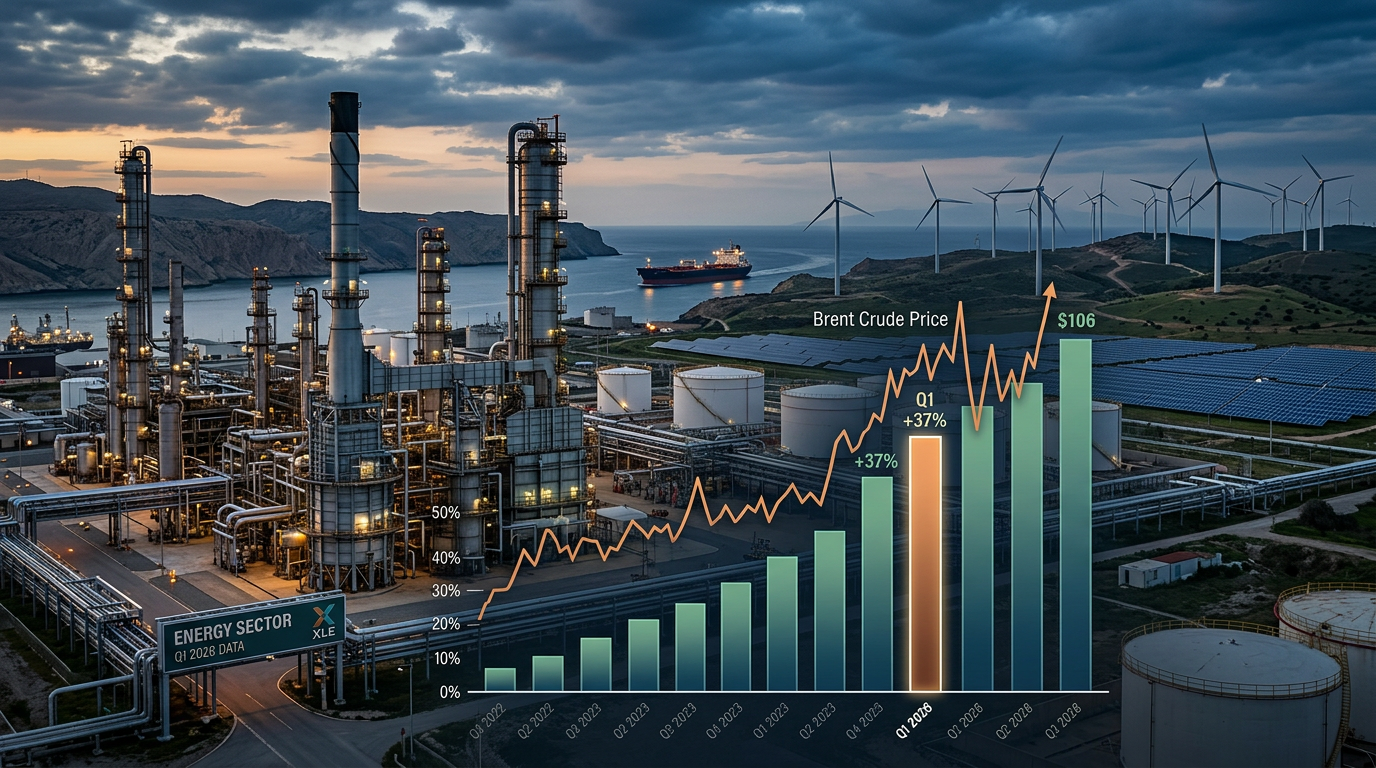
Energy is the best-performing sector of 2026. That’s not a forecast — it’s a fact. XLE gained 37.02% in Q1, while the S&P 500 dropped 4.63% over the same period. Year-to-date through late May, energy still leads all sectors with a 34.5% return, sitting well ahead of the second-place technology sector at 22.3%. Those numbers are real. What matters now is the structural setup underneath them — and it’s more fragile than the headline performance implies.
Here’s the context most traders are missing.
The EIA’s May 2026 Short-Term Energy Outlook documented production shut-ins averaging 10.5 million barrels per day in April, with expectations that figure peaks near 10.8 million b/d in May as storage limits force additional volume offline. Brent crude has been trading around $106/barrel through May and June per EIA projections — a level almost entirely attributable to geopolitical risk premium, not demand fundamentals. Global oil demand growth was actually revised down to just 0.2 million b/d for 2026, a dramatic cut from the 1.2 million b/d estimate in February’s STEO. The Strait of Hormuz closure, a direct result of the U.S.-Israel strike on Iran in late February, has placed the entire Persian Gulf supply chain under a blockade that remains largely at a standstill.
Inside the Sector: The Divergence Nobody Is Talking About
When crude jumps, energy stocks don’t move in lockstep — and Q1 2026 made that abundantly clear. APA Corporation surged 73.51% for the quarter. Texas Pacific Land followed at 65.23%. Occidental Petroleum added 58.07%. On the other end, Expand Energy (EXE) was essentially flat, down 0.53% for the same period. In March alone — the most turbulent part of the quarter — APA gained 39.74%, while Baker Hughes, Williams Companies, and TPL all closed lower.
The divergence matters because it reveals something structural: XLE’s top holdings, Exxon Mobil and Chevron, carry outsized index weight. A world of sustained high oil prices benefits upstream producers disproportionately. A world where prices normalize — which the EIA projects, with Brent falling to $89/b in Q4 2026 and $79/b in 2027 — compresses margins for integrated majors while rewarding refiners and midstream at different rates. Chevron and Phillips 66 chart structures remain technically bullish per multiple technician reads through May, but the futures curve tells a different story: it remains steeply backwardated, consistent with investor expectations that elevated oil prices are largely temporary.
The Risk Layer Most Traders Are Underweighting
There’s a nontrivial risk that focused attacks or harassment on U.S.-linked tankers and infrastructure could create event-driven losses for U.S.-denominated names — even as crude prices remain elevated. That asymmetry is worth pricing in. Separately, the medium-term supply response is already underway. High oil prices historically spur non-Middle East production investment, new pipeline routes, and capex in regions considered geopolitically safer. Guyana is the most-cited new basin. The same dynamic that drove OPEC’s market share erosion after the 1970s shocks could play out again on a compressed timeline.
On the demand side, the crisis is accelerating the energy transition in ways that aren’t yet reflected in most energy stock valuations. The fragility of fossil fuel supply chains is now on full display, and renewable buildout — solar, storage, electrification — is being fast-tracked by governments across Europe and Asia as an energy security imperative, not just a climate one.
Technical Framework
XLE’s DeMark pivot structure shows a recent pivot high near $61.99 with support at $60.79. The sector has stalled meaningfully since its Q1 peak — energy’s strong start to 2026 had largely plateaued by May. Volume patterns have been consistent with distribution at the highs rather than accumulation. The 50-day moving average remains directionally intact, but momentum indicators have flattened. VWAP analysis for the trailing 30-day period places near-term institutional cost basis in the $58–$60 range for XLE — a level that becomes the critical pivot if Brent prices begin to slide toward the EIA’s Q4 forecast range.
Scenario Modeling
Bull Case: The Strait of Hormuz remains effectively closed through Q3. Brent holds above $100. Upstream producers — particularly APA, OXY, and Marathon Petroleum — continue to generate outsized free cash flow. XLE retests its Q1 highs. Institutional flows accelerate into the sector as stagflation hedging intensifies.
Base Case: A partial diplomatic resolution emerges in late Q2 or early Q3, allowing some Persian Gulf production to resume. Brent slides to the $89–$95 range. Sector performance bifurcates sharply — upstream names correct 15–20% while midstream and LNG exporters hold up better. XLE consolidates between $58 and $65.
Bear Case: A ceasefire accelerates faster than expected. Brent drops sharply toward $79–$82. The sector re-rates to reflect demand-adjusted fundamentals. XLE gives back a meaningful portion of its Q1 gains as the geopolitical risk premium unwinds in a compressed timeframe. Names like EXE and WMB — which didn’t fully participate in the Q1 surge — show relative resilience, while Q1 outperformers face the steepest reversion risk.
Active Trader Positioning Considerations
The energy trade of 2026 is not a buy-and-hold story — it’s a precision trade defined by a singular catalyst that has a finite shelf life. Traders should distinguish clearly between integrated majors, pure upstream producers, midstream operators, and LNG exporters, because each subsector faces a meaningfully different fundamental setup as supply normalizes. Position sizing relative to geopolitical risk premium — not earnings or cash flow — is the relevant framework right now. Volatility in crude itself remains elevated, and oil stock beta to crude has been inconsistent this cycle, meaning directional oil trades don’t cleanly translate to equity positions without basis tracking. Key levels to watch: Brent $100 as psychological support for the bull thesis; $89 as the EIA’s Q4 central estimate and a potential inflection point for sector sentiment.
The S&P 500 just posted its eighth straight week of gains. Energy was the sector that started this year’s story. Whether it finishes it — that’s still very much an open question.
For informational and educational purposes only. Not investment advice. Trading involves risk, including loss of principal.