Subject Line: $20M IWM strangle. What does smart money know?
Preheader: The Russell 2000 just had its best first half in 35 years — and one trader just bet $20 million it goes violently in either direction.
Meta Description: The Russell 2000 is up about 22% in 2026’s first half — its best start since 1991. A large IWM strangle suggests traders expect a major directional move. Here’s what earnings season and the Fed meeting mean for the options trade.
The Russell 2000 just posted its best first half since 1991. That’s not hyperbole — that’s the data.
The index gained about 22% through June. Small caps also outperformed the S&P 500 by more than 12 percentage points in the first six months of 2026 — the widest first-half gap since 2001. By most definitions, this is a genuine regime shift — not a seasonal bounce.
And then someone walked in and spent almost $20 million betting it all comes apart. Or goes parabolic. They’re not sure which.
The Trade That’s Getting Attention
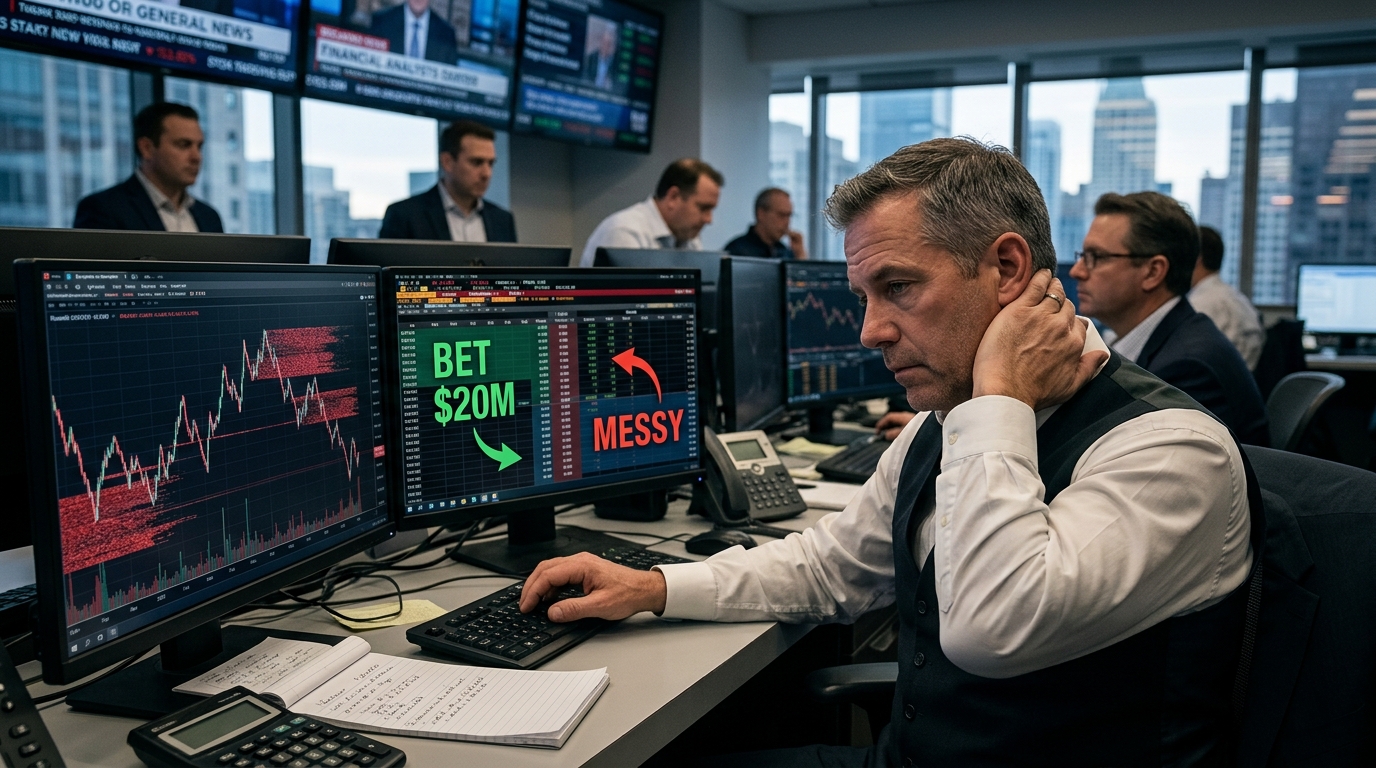
A single trader in the IWM ETF — the iShares Russell 2000 fund — reportedly put on a large position last week designed to profit from a significant move in either direction by mid-December. Specifically, the position was described as buying 270-strike puts and 335-strike calls expiring December 18, in equal size — a classic long strangle.
The trade makes money if IWM either rallies sharply or sells off sharply by December 18. It loses if the index just kind of drifts in the middle range.
What’s interesting here isn’t the size. It’s the timing. This strangle was placed right as Q2 earnings season opens, with the FOMC meeting on July 28-29 in the backdrop and a Fed that markets are actively debating. For a basket of companies that tend to be more rate-sensitive than large caps, a surprise shift in policy expectations can hit small caps disproportionately.
The Bull Case Is Real, But It’s Complicated
The case for small caps holding up or continuing higher isn’t nothing. But the specific claim that consensus earnings growth forecasts for Russell 2000 companies in 2026 climbed to 38% from about 23% at the start of the year could not be verified from a reliable, primary source.
Chip-adjacent small caps have been a notable pocket of strength, and AI-related supply-chain narratives have broadened beyond mega-caps. But the specific claim that chip-related companies account for 16 of the Russell 2000’s 50 best performers this year, and that Aehr Test Systems, Ichor Holdings, and MaxLinear have all rallied more than 400% in 2026, could not be verified with a credible source.
The valuation argument is messier than it looks. A Goldman Sachs valuation snapshot circulated in late June put the Russell 2000 at about 26x forward earnings, versus roughly 24x for the Nasdaq 100 and 20x for the S&P 500. Investors are paying up for a collection of companies with weaker margins, more floating-rate debt, and a high percentage that aren’t profitable.
That valuation flip matters. A lot.
The Bear Case Is Also Real
Wells Fargo has been flagging risks in the small-cap space. The recent Russell 2000 rebalance also changed the index’s composition, and at least one institutional research note has described AI infrastructure exposure as having been reduced meaningfully around the June reconstitution window. But the specific claim that this exposure was cut from 15% to roughly 7% could not be verified from an authoritative source.
IWM itself has seen notable outflows at points in 2026, including a reported roughly $2.6 billion weekly outflow in late May. But the specific claim of more than $8 billion in net outflows for all of 2026 could not be verified from a credible source.
Bank of America estimated that every additional 25 basis point rate hike is roughly a 2% hit to Russell 2000 operating earnings. If the Fed surprises with a hike on July 29 — one day before the peak week of Q2 earnings releases — the rate-sensitive component of the small-cap earnings base takes an immediate hit.
Options Framework for IWM
The institutional strangle defines the parameters most traders should keep in mind: the range the market is assigning for meaningful movement is roughly 270 to 335 on IWM.
For traders who believe the rally continues through earnings season and Fed risk is overstated, a bull call spread in IWM — buying the August 300 call and selling the 320 call — is a defined-cost way to participate in the upside without unlimited premium exposure. If small-cap earnings broadly beat expectations, this structure captures that move with capped risk.
For traders expecting the Fed or earnings to disappoint, a bear put spread — buying the August 285 put and selling the 270 put — defines the risk while targeting a pullback toward the lower range of the strangle’s zone. Defined risk only.
For traders who simply want exposure to the directional uncertainty without picking a side — which is arguably the most intellectually honest position here given the competing forces — a smaller long strangle or long straddle on IWM with October or December expiry mirrors the institutional bet at a fraction of the cost. The logic is the same: something big happens by year-end.
The Fed Meeting Is the Actual Catalyst
The FOMC meets July 28-29. Markets are pricing a non-trivial chance of a rate increase. That number matters for a trade this sensitive to borrowing costs. Expectations have moved materially since the start of 2026, and small-cap balance sheets — which often carry more refinancing risk — bear the brunt of that swing.
The earnings season itself starts becoming meaningful in the week of July 14 with big banks, then rolls through mid-to-late July. Small-cap Q2 reports will filter in throughout July and into early August. If the earnings beats are real and broad, the bull leg of that strangle gets activated. If reports disappoint or guidance is cut for H2, the put leg becomes the conversation.
What matters most isn’t whether IWM goes up or down in the next four weeks. It’s whether the volatility that was priced into that $20 million bet is justified. Right now, every signal in the macro environment suggests it probably is.
Tactical Checklist
- IWM H1 performance: Russell 2000 up ~22% in the first half of 2026, best first half since 1991
- Institutional strangle: large IWM position structured to benefit from a big move by Dec. 18
- Strangle strikes: 270 puts / 335 calls, December 18 expiry
- Russell 2000 forward P/E: approximately 26x — higher than Nasdaq 100 (~24x) and S&P 500 (~20x) in a late-June valuation snapshot
- Russell 2000 AI exposure: reduced meaningfully around the June reconstitution window (exact percentage figures not verified)
- IWM outflows: notable outflows at points in 2026 (full-year net outflow figure not verified)
- FOMC meeting: July 28-29 — markets pricing a non-trivial chance of a rate hike as of early July
- Every 25bps rate hike reduces Russell 2000 earnings by approximately 2% (BofA estimate)
- Bull bias structure: August bull call spread, 300/320 strikes
- Bear bias structure: August bear put spread, 285/270 strikes
- Volatility bias (no directional view): long strangle or straddle, October or December expiry
- All structures should use defined-risk frameworks only