Hey there, bargain hunter. UPS just handed you two numbers that tell completely different stories about the next 60 days.
Scoreboard
Adjusted diluted earnings per share came in at $1.69, while revenue reached $22.9 billion. For full-year 2026, UPS now expects consolidated revenue of approximately $92.6 billion, up from its previous projection of $91.2 billion, with adjusted operating profit guidance at $8.75 billion and adjusted EPS at $7.28. That is a company tightening its execution into the most expensive stretch of the year.
The Real Reason This Matters
For the second consecutive quarter, revenue per piece growth outpaced cost per piece growth, contributing to operating margin expansion in the domestic segment. In raw terms, revenue per piece rose $0.82 to $14.29 while adjusted cost per piece rose $0.69 to $13.32. Ninety-seven cents of spread. That is the margin the holiday season now has to protect.
The Holiday Cost Problem
Here is where it gets complicated. UPS is walking into its highest-volume quarter with a published surcharge calendar that front-loads cost pressure on precisely the packages that move in bulk during the rush.
- Packages needing additional handling cost $8.75 each from September 27 through November 21, then jump to $11.90 from November 22 through December 26.
- UPS adds $0.50 to $0.75 per package on residential ground and Ground Saver from October 25 to January 16.
- Compared with 2025, analyses of UPS’s published peak schedule said some flat service-level charges rose roughly 22% to 25% for 2026.
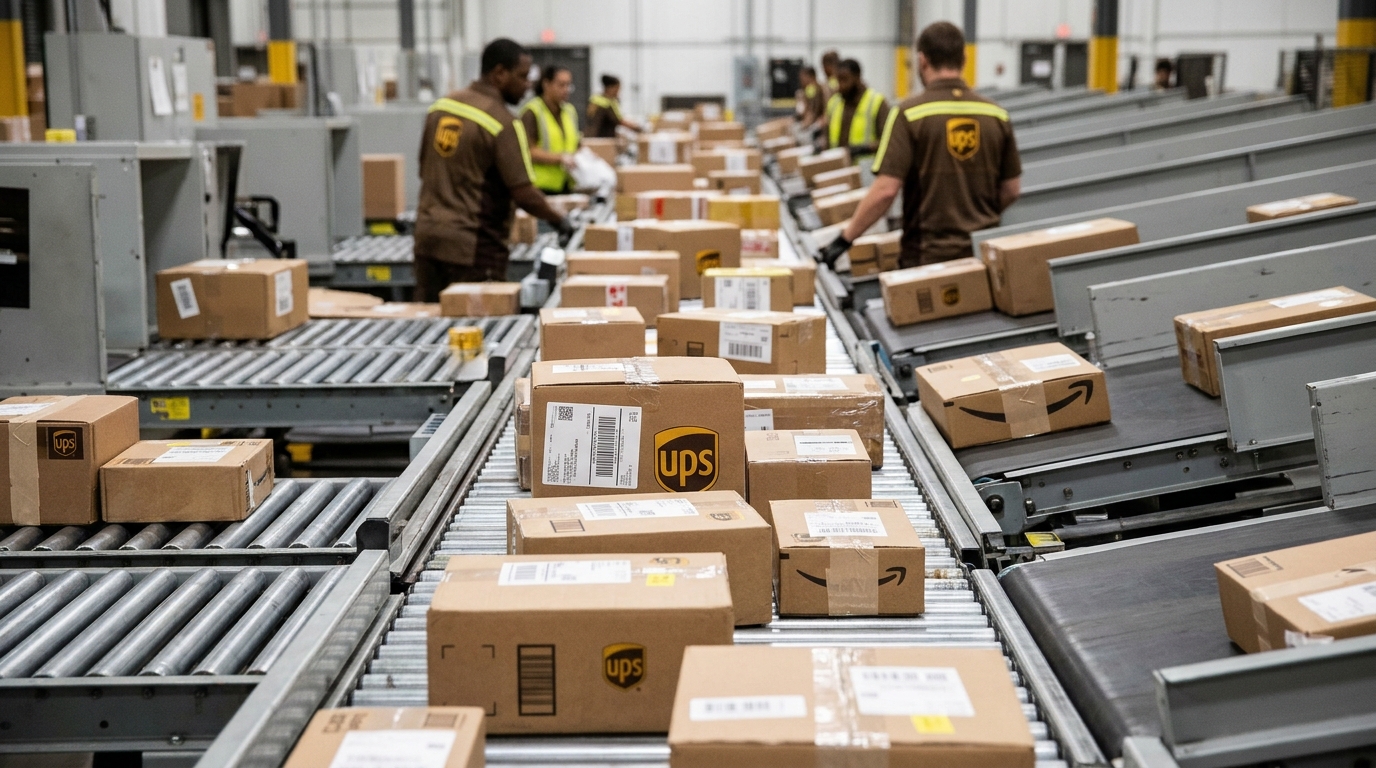
UPS collects these surcharges, but it also absorbs the surge in labor, fuel, and temporary infrastructure required to move a significantly larger volume. Axios reported that CEO Carol Tomé said on the October 27, 2026 earnings call that UPS expects average daily U.S. package volume to jump about 25% from Q3 to Q4. More packages means more cost, even with automation gains.
Is the Spread Defensible?
Management said UPS is entering the holiday shipping season with the most automated and efficient network in its history. That is the bull case in plain English: the network reconfiguration absorbs volume without proportionally adding cost, and surcharges pass the incremental expense to shippers.
The bear case is simpler. Revenue growth was driven by a 6.1% year-over-year increase in revenue per piece. Strip out fuel, and underlying pricing can look thinner. If diesel softens or volume mix skews toward lower-yield residential packages, the spread compresses fast.
Cheap Investor Checklist
- Revenue per piece vs. cost per piece spread: must stay positive through Q4
- Domestic adjusted operating margin: currently 7.0%; watch for Q4 contraction
- Peak surcharge pass-through: are shippers absorbing or pushing back volume?
- Full-year free cash flow target: raised to approximately $6.1 billion
- Volume mix: residential versus commercial balance during the surge
Bottom Line
If UPS holds the revenue-per-piece lead over cost-per-piece through December, the guidance raise is credible and Q4 confirms the transformation story. If fuel softens and residential volume floods the network, that spread is where the damage shows first. Watch the spread, not the headline revenue number.