September 18, 2026
Bonus Content: Gold and Silver Bounced After the Fed Hiked. How Much Should You Own Right Now?
Marvel was valued at $54 billion. Star Wars at $181 billion. And Pokemon at $115 billion.
What do they have in common? IP with a passionate fanbase.

And that’s great news for companies like Skybound Entertainment.
Skybound is one of the few companies that have successfully struck deals with major streamers and studios while keeping 250 of their own IP properties and the profits across gaming, merchandise, and licensing.
The opportunity to own a piece of it closes soon.
Here’s how they use that IP to create global franchises: They create the comics, where audience response helps shape their next breakout hits, then scale the strongest stories through TV and film, and monetize through releasing games, merchandise, and more. The Walking Dead and Invincible are just two big names in their portfolio.
Now you can own a piece of what’s next. Final days to invest before the opportunity ends.
Gold and Silver Bounced After the Fed Hiked. How Much Should You Own Right Now?
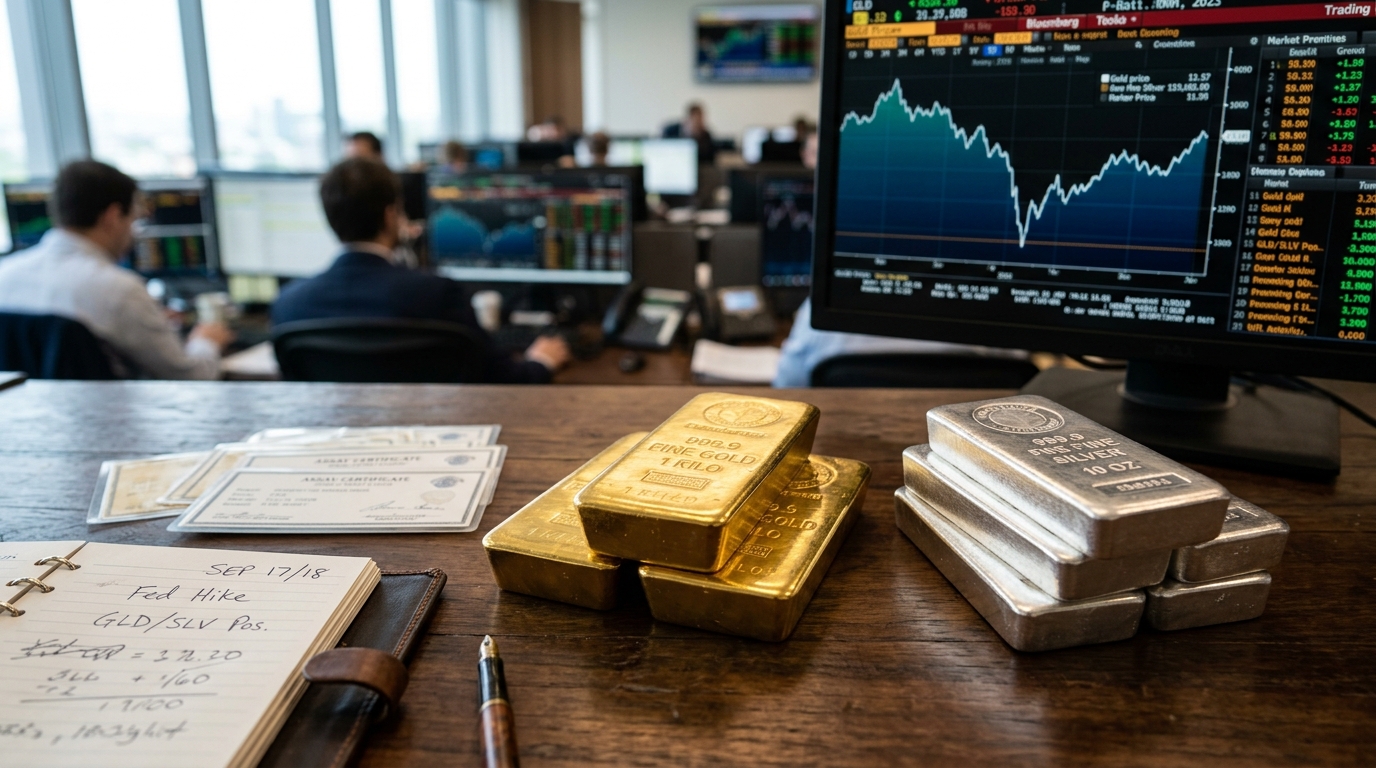
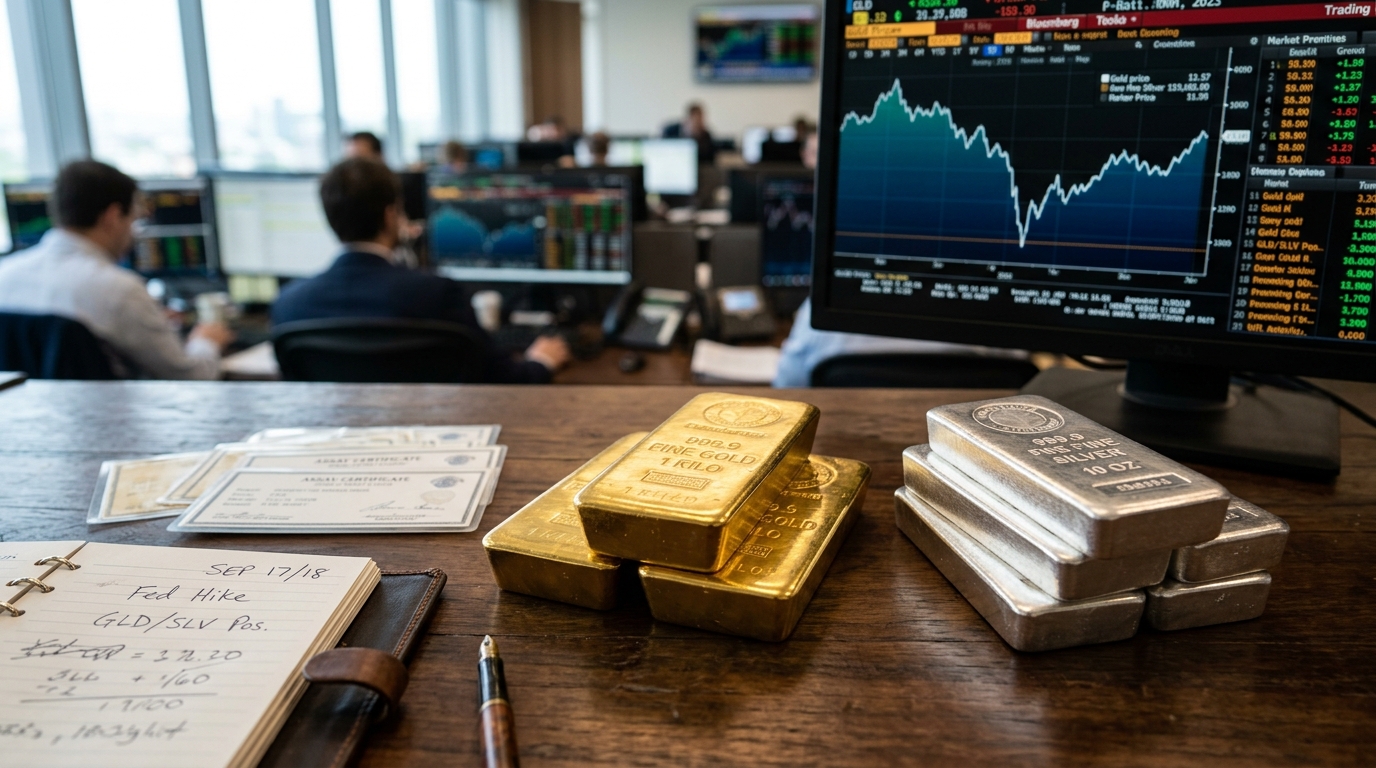
Gold does not usually rally the morning after a Fed rate hike. It did on Thursday, September 17, and held those gains into Friday. Gold traded around $4,356 on September 18, up modestly from the previous session. Silver traded around $66 per ounce, up modestly on the day. That two-day recovery matters less for its size than for its timing: both metals reversed sharply less than 24 hours after the Fed delivered exactly the hawkish outcome the market had been dreading.
The Fed raised rates 25 basis points to 3.75%–4.00% in a unanimous 12-0 vote, its first hike since 2023. But 16 of 18 officials still projected more tightening, and gold and silver gave back their morning gains within the half hour. That knee-jerk selloff lasted roughly one session. By Thursday, gold extended gains toward $4,400, supported by falling oil prices that eased inflation concerns and helped pull bond yields lower, with the 10-year Treasury yield retreating to around 4.93% after briefly exceeding 5% earlier in the week.
The bounce is worth examining, but the bigger number is the one behind it. Gold reached its all-time intraday peak near $5,590 per ounce in late January 2026. At roughly $4,356 today, the metal sits about 22% below that level. Silver near $66 is up about 60% from a year ago and remains well below its own January record near $121 per ounce. Both metals are on sale relative to where institutional buyers were aggressively adding exposure eight months ago.
Why the Selloff Created an Opportunity
In August 2026, global physically backed gold ETFs took in $18 billion, lifting holdings by 121 tonnes to a record 4,189 tonnes, with assets under management up 16% month-on-month, per the World Gold Council. That buying streak ran through the rate hike rather than unwinding ahead of it, suggesting institutional buyers are not treating this Fed cycle as a rate-trade to exit when policy tightens.
Central banks, particularly from China, India, Poland, Czechia, and Middle Eastern nations, have been net buyers of gold for four consecutive years, diversifying away from USD-denominated reserve assets following the 2022 freeze of Russian central bank reserves. Any central bank that observed that episode has a strategic reason to hold more gold, and that structural bid provides a floor that did not exist before 2022.
Silver adds a second engine. The Silver Institute’s World Silver Survey projects that 2026 marks the sixth consecutive year of supply deficit, with mining supply unable to keep pace with demand. That persistent shortfall is a structural tailwind with no direct equivalent in the gold market. Silver also carries industrial demand from solar energy, electric vehicles, and 5G infrastructure, giving it a growth dimension gold cannot match.
How Much to Hold Now
The allocation question is where most long-term investors underact. Most financial advisors and institutional analysts recommend holding between 5% and 15% of an investment portfolio in gold, with 10% serving as a widely cited benchmark for balanced diversification. Balanced portfolios do not have a single standard split between gold and silver, and recommendations for silver allocation vary widely by risk tolerance.
Research firms and asset managers have challenged conventional portfolio construction norms, particularly the durability of the traditional 60/40 framework, and some argue that a meaningfully larger gold sleeve can improve outcomes. But specific claims about what high-net-worth investors “currently” hold in gold, or gold’s exact share of total global financial assets, vary significantly by dataset and are not consistently reported in a single comparable way.
A practical framework: investors focused primarily on wealth preservation should consider 8%–10% in gold via GLD or physical metal, with a 3%–5% silver complement through SLV. Those willing to accept more volatility for higher potential return can tilt toward silver and look at GDX for leveraged exposure to the miners, understanding that operating leverage cuts both ways. Position size matters more than entry timing here. The discount from January’s peak reduces the risk of buying a short-term top.
The Risk That Ends This
The Fed’s projections indicate another rate increase is likely before the end of 2026. A dollar that strengthens materially on additional hikes would pressure both metals. Immediate resistance for gold sits at $4,400, and a decisive break below the $4,340–$4,300 support zone opens the door to next support near $4,200. That is the range to watch if you are scaling in.
The core lesson from this week: the hedge that looked broken during gold’s three-week slide into the FOMC started working again the moment yields pulled back. That is exactly how a long-term position in precious metals is supposed to behave, and a roughly 22% discount from the January peak is the kind of entry point that tends to look obvious in hindsight.